Order Book, How Market Depth Reveals Liquidity and Hidden Pressure
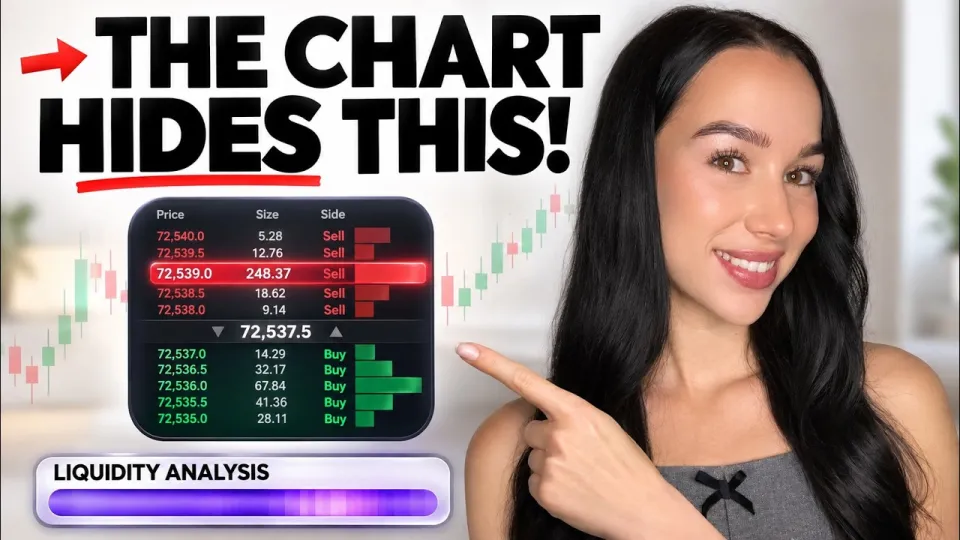
Video: What the Chart DOESN'T Show You! Order Book Trading Explained
· based on the channel Lisa / Trading Academy
The order book is a live list of pending limit orders at each price level, showing where buyers and sellers have committed to trade before price arrives. It reveals market depth and liquidity that a candlestick chart never displays, and traders use it to judge whether a level is likely to hold, break, or be absorbed. Reading it correctly means treating it as context for price action, not as a standalone signal.
The video breakdown by Lisa / Trading Academy covers exactly this gap between the chart and the book, and the channel's indicator pack is available through this Telegram link.
What an order book actually shows
An order book displays two columns of resting limit orders: bids on one side, asks on the other, sorted by price with the best prices closest to the current market price. Each row combines a price and a size, so a trader can see how many units are queued at every level. This is market depth, and its shape tells you how much volume must be traded before price can move to the next level.
Three properties matter most:
- Resting orders are intentions, not commitments. Any limit order can be cancelled before it is filled, which is why walls vanish seconds before price touches them.
- The book shows only limit orders. Market orders that hit the book and trade immediately appear in the tape and on the chart, not in the depth display.
- Depth is asymmetric by nature. A thin side means little resistance to movement; a dense side means price must chew through size to advance.
A chart compresses all of this into a single price per candle. The book shows the queue behind that price.
Why large orders do not guarantee a reversal
A large buy or sell order in the book is often read as a wall that will stop price, but that interpretation fails regularly. A big sell limit order can be consumed by aggressive buyers in seconds, and when it is eaten, price often accelerates upward rather than reversing. The wall was not a barrier; it was fuel.
The reverse is equally common. A visible buy wall can be pulled the moment price approaches, leaving nothing behind and letting price fall straight through the level. Traders who placed entries in front of the wall get stopped out on a move that the book seemed to forbid.
This is why liquidity absorption matters more than size. When heavy selling hits a bid level and price refuses to drop, buyers are absorbing supply, and that is a stronger signal than the number of contracts displayed. When heavy buying hits an ask level and price stalls, sellers are absorbing demand.
Finding support and resistance in market depth
Order book levels can be used to locate potential support and resistance, but only as a supplement to structure that already exists on the chart. The practical sequence is:
- Mark the levels where price previously reversed or consolidated on a higher time frame.
- Check whether the book shows concentrated size at or just in front of those levels.
- Watch how price reacts on approach: rejection, absorption, or a clean pass-through.
- Confirm with a candle close beyond the level before acting on a breakout.
A cluster of bids below the current price suggests buyers are defending that zone; a cluster of asks above suggests sellers are waiting. But a level with no visible size can still hold, because liquidity is often hidden or added only when price arrives. Treat the book as one input among several, and never as a reason to ignore the chart.
Reading buying and selling pressure
Buying and selling pressure in the book is visible as the balance between executed aggression and resting size. A practical way to judge it:
- Compare the size of recent market buys against market sells in the tape.
- Note whether price rises on strong buying but stalls on similar selling, or vice versa.
- Watch whether resting size on the bid side grows as price falls, which suggests accumulation.
- Watch whether resting size on the ask side grows as price rises, which suggests distribution.
Pressure is a process, not a snapshot. A single heavy print means little; a pattern of absorption at the same price over several minutes means a great deal. This is also why experienced traders combine depth reading with volume and candle structure rather than staring at the book alone.
Confirming breakouts with the book and price action
Breakouts are where order book analysis adds the most value, provided it is used for confirmation rather than prediction. The steps are consistent:
- Identify a level where sellers or buyers have repeatedly defended price.
- Watch the book as price approaches: is the opposing size being consumed, or is it being pulled?
- Require a candle close beyond the level on your trading time frame, not just a wick.
- Check the higher time frame to see whether the breakout aligns with the broader trend.
- Look for a retest that holds, with the old level now acting in the opposite role.
A breakout supported by absorption of the opposing wall and a decisive close is far more reliable than one where the wall simply disappeared. When size is pulled rather than traded, the move often lacks follow-through because no real volume changed hands.
Common questions from traders
Beginners most often ask how much weight to give a wall they can see right now. The honest answer is less than they expect: the book is a snapshot of intent that can change before the order ever fills, so a wall is a hypothesis to test, not a conclusion.
A second recurring question is whether order book analysis replaces technical analysis. It does not. The book explains why a level might hold or break; structure, trend and candle closes tell you whether the market is actually doing it. Traders who watch depth without a chart framework tend to overreact to noise, while traders who use the chart alone miss the absorption that precedes the strongest moves.
The third theme is timing. Depth data is only meaningful in the minutes around a level, and it degrades quickly on lower time frames where spoofing and cancellation are constant. Filtering for higher time frame levels and waiting for a confirmed close removes most of the false signals the book produces on its own.
Conclusion
The order book shows the liquidity behind the chart: where limit orders sit, how deep the market is, and whether large size is being defended or absorbed. Its value comes from confirmation, not prediction, and the strongest setups combine depth reading with structure, candle closes and higher time frame context. Lisa / Trading Academy walks through this workflow step by step, and the channel's indicator set is available via the Trading Academy Telegram link. Remember that depth data changes in milliseconds and no signal guarantees a profitable trade.
Key takeaways
- The order book shows resting limit orders, not executed trades, so every level in it can be cancelled before price arrives.
- A large sell wall can be absorbed by aggressive buyers, and that absorption often precedes a stronger move than the wall itself suggested.
- Order book data changes in milliseconds, so it is only useful as confirmation alongside price action and higher time frame structure.
- Breakouts are more reliable when the opposing liquidity is consumed and price closes beyond the level on the candle, not when the wall simply disappears.
- No single signal from market depth guarantees a profitable trade; the book describes intent, not outcome.
Questions & answers
How do I read an order book for beginners?
Start with the two sides: bids below the current price and asks above it, each showing price and size. Look for clusters of large size near levels you already marked on the chart, then watch whether that size gets traded or cancelled as price approaches. The book is context, so confirm every idea with a candle close.
Why do large orders in the order book disappear before price reaches them?
Because limit orders can be cancelled at any time before execution. Traders and algorithms place size to influence perception, then pull it when price gets close. A wall that vanishes is a warning that the displayed liquidity was never real, and breakouts through such levels often lack follow-through.
Does a big sell wall mean price will reverse?
Not necessarily. If aggressive buyers absorb the sell order, price can accelerate upward once the wall is consumed. The signal is in the reaction, not the size: stalling at a wall suggests absorption, while a clean pass-through suggests the wall was never a real barrier.
Can I trade using only the order book without technical analysis?
It is possible but unreliable, because depth data changes in milliseconds and is full of noise on lower time frames. The book works best as confirmation for levels identified on the chart, combined with market structure and higher time frame trend. Using both reduces false signals significantly.
Source: What the Chart DOESN'T Show You! Order Book Trading Explained · Markdown version